Football is all about exploiting space: being in the right place at the right time is paramount. A player blessed with technique, acceleration or speed will be ineffective if they cannot read the space around them or understand positioning. These qualities are the difference between good, talented players and consistent world-class players.
The eternal quest for space on the field is essential for 'route one' teams that rely on defenders and defensive midfielders playing long balls in behind to pacey wingers or tall, physical forwards (e.g. Dortmund, Burnley), 'tiki-taka' teams that rely on technical players who aim to unlock a defence by pinning them into their box and playing a high line to negate the threat of losing possession, as well as every other style in between. Coaches now demand that every player have an understanding of space, how to maximize it for themselves and minimize it for their opposition (and increasingly, goalkeepers too: Ederson, for instance, is one of the best goalkeepers at reading the trajectory of long balls and coming out to clear them, which is essential for Pep Guardiola's gameplan).
By repeatedly implementing training routines with pitch divisions and zones with the aid of video analysis, any player can learn to identify what is required to properly exploit space. Over the years, this search for space has become a precious tool in the arsenal of a flexible and effective team, and as more teams move up the football pyramid and more money is injected into the sport, they acquire more data to work with. However, visualizing this exploitation of space is a complicated matter.
Different uses of space
For a goalkeeper, space management occurs when they progress the ball up the field by hand or foot, in order to put the targeted player in the best conditions to exploit the ball. Again, Ederson is the best in the world at this skill and many have hypothesized whether he would be better suited to a Pirlo-esque role as a regista!
In the case of a defender, managing space is achieved by tightening the line and leaving no gaps for opposing players. In world football at the moment, Thomas Tuchel is the most proficient at rapidly setting up a solid, almost airtight backline.
For a midfielder, the search for space manifests itself via sharp passes, breaking defensive lines and putting attackers in the best positions. Midfielders of past and present who are famous for excelling at all these skills include Xavi, Ozil, and Glenn Hoddle.
Finally, if an attacker wants to dribble forward at pace, they need to be in space. Alternatively, he can create space for others with decoy runs, holdup play (which can even pin defenders back, ruining the offside trap) and draw defenders towards him before playing a quick pass into space for an oncoming runner. In the modern game, Giroud, Kane and Benzema famously possess these skills.
Voronoi diagram
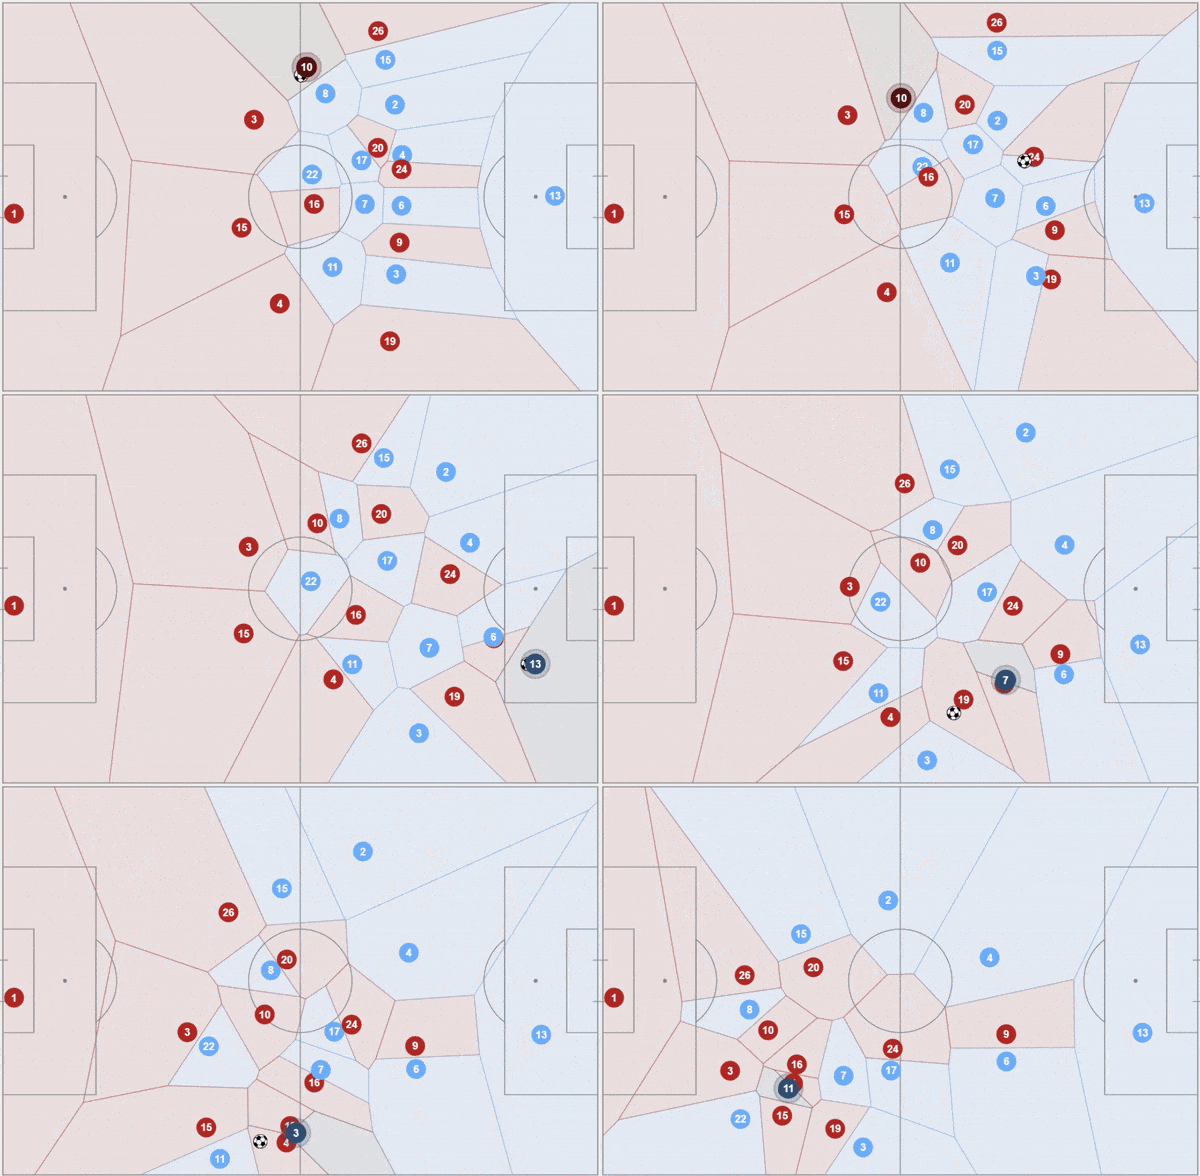
Until now, the Voronoi diagram was the only tool that allowed us to identify potential spaces on the field for players to take up. This was based on how far away the closest opposition player was. In these diagrams, a player dominates a given space if he is the closest player to that point.
However, the Voronoi diagram does not take into account the position of the ball, the speed of the players or which way they are facing, which invalidates any conclusions that are drawn from it.
From distance to time: the introduction of Dynamic Pitch Control
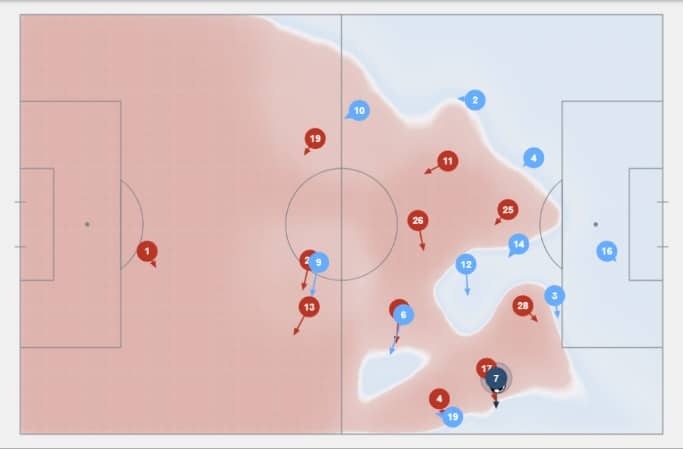
These shortcomings led to introduction of Pitch Control, an alternative created by William Spearman, Lead Data Scientist at Liverpool FC. The major difference between Voronoi and Pitch Control is that the latter considers how long players will take to reach the ball. If, for instance, a slow defender like Thiago Silva was standing still, facing the opposition goal when a long ball is played over his head while Kylian Mbappe is already running at full speed towards goal, the Pitch Control widget would take into account all these factors to determine that Mbappe had a much better chance of reaching the ball before Thiago Silva.
However, it is impossible to be 100% sure that a given area of the field will be controlled by a player. It is therefore important to introduce the notion of uncertainty; for instance by estimating the probability of successful passes, and evaluating the passing options of a player.
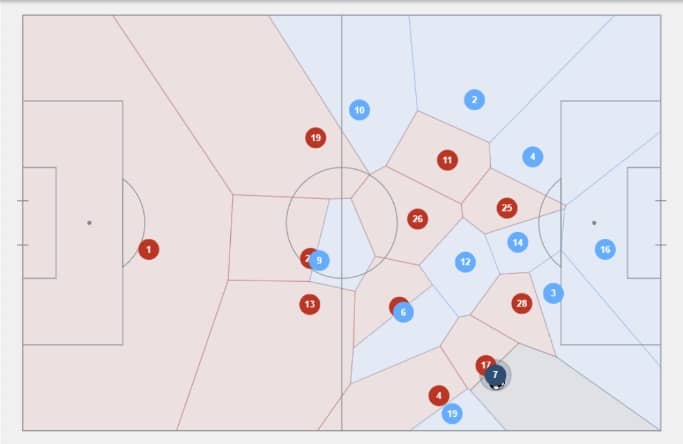

Side by side, the differences between the Voronoi diagram (on the left) and the Pitch Control (on the right) are clear. In this situation, the blue team is attacking and the number 7 has the ball. With the Voronoi diagram, the blue number 6 is in plenty of space, whilst the same is true for the blue number 9 and 10. But, with the Pitch Control, the conclusion is completely different: the blue players have much less space around them, and the red players encircle the blue number 9, showing that the Voronoi diagram was inaccurate. Furthermore, visualization of the density of players on the same team is incomplete, as the Voronoi diagram only shows which player is the nearest for each pitch zone, whilst Pitch Control takes into account whether the player is isolated or not, and therefore what his chances are of getting the ball.
Thanks to Pitch Control, it becomes easier for coaches and analysts to evaluate the relevance of their players' choice of runs with and without the ball, their attempted passes, and their choice of starting position on the pitch.
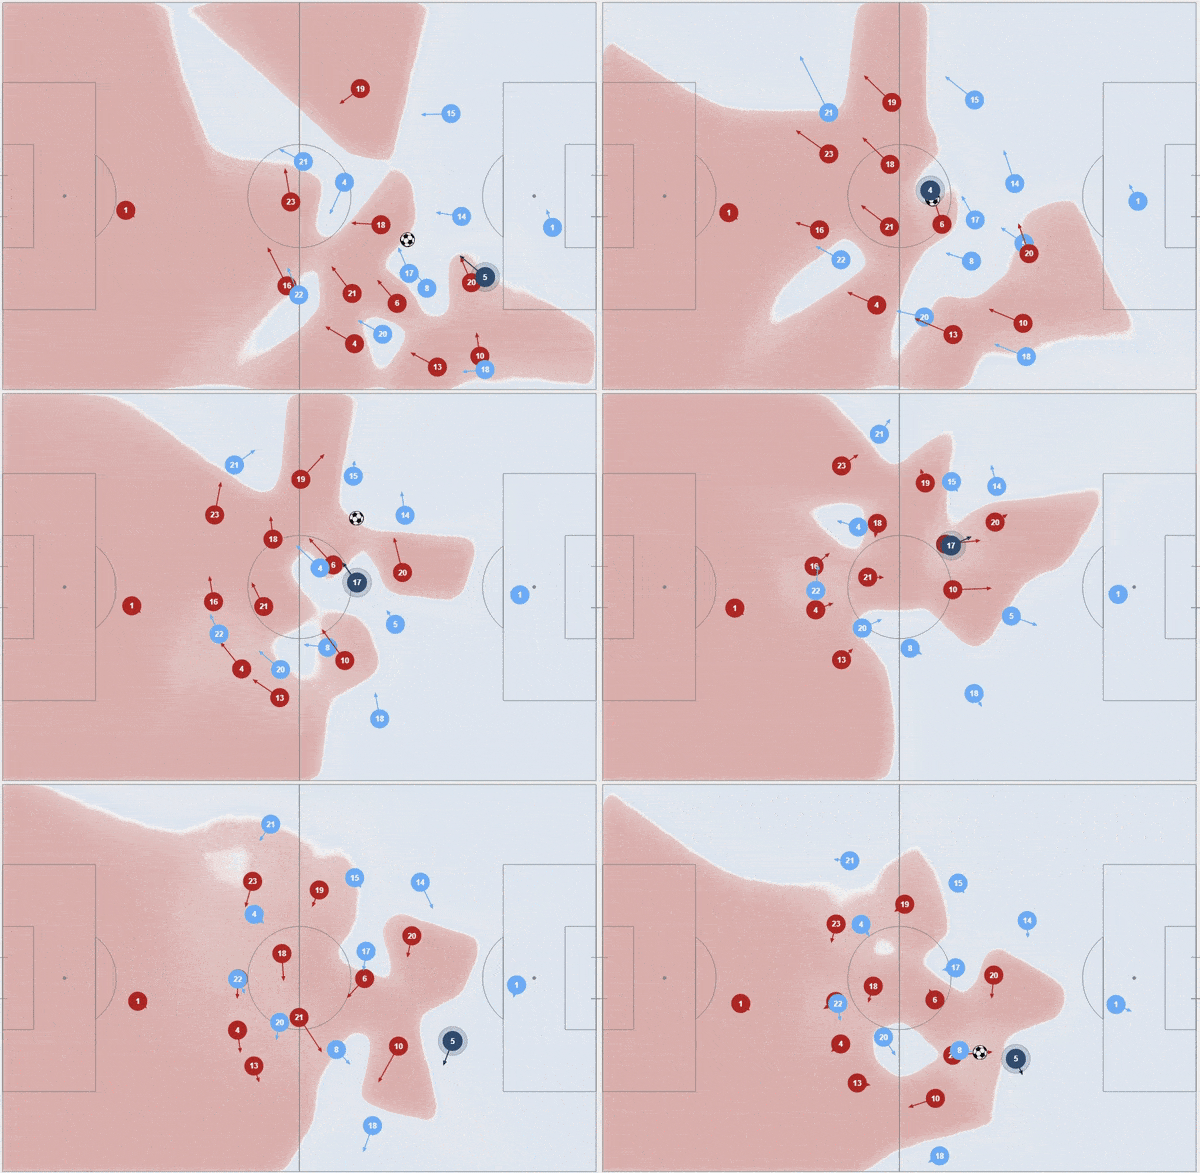
Footovision has developed its own Dynamic Pitch Control widget, a two-dimensional video tool that shows which areas of the field are controlled by which team, as well as the movement of players on both teams, using a vector to show the direction of travel for each player. Territorial domination and space management are visualized and based on the players' movements, giving a two-dimensional animation where the field and all the players on it are visualized.
With its innovative technology and numerous filters available on its analysis dashboards, Footovision can focus on a specific event of the match and create an instant video of the event, side by side with the Pitch Control 2D animation of the event. This interactive aspect between widgets allows users a huge advantage in assessing any given situation on the field.
