Footovision provides elite stakeholders in the football industry with advanced performance indicators which combine ball events, non-ball events and physical performance data. However, with these diverse metrics at their disposal, our clients must be wary of making inaccurate conclusions with uncontextualized data.
That is why we have attempted to incorporate the missing context in individual performance indicators into our VAEP metric. “Valuing actions by estimating probabilities” is a KPI originally developed by the DTAI Sports Analytics Lab in 2019 which calculates whether a player’s action on the ball had a positive or negative effect on the chance of scoring a goal in the next ten actions.
To calculate the components of performance, we considered 16 types of actions with different weightings of positivity or negativity. We then added the duration of the event in seconds, whether it was successful or not, and the Pitch Control Delta - a measure of the shift in a team’s domination of pitch space caused by that action.
Moreover, we added two variables that indicate the ball carrier’s distance to the nearest defender at the start and end of the action, enabling us to judge the pressure exerted on the player performing the event. Finally, we considered context variables on a more global match scale. Herein lies the time elapsed in the match, a variable indicating whether the team performing the action is playing at home, and one indicating whether the team is winning.

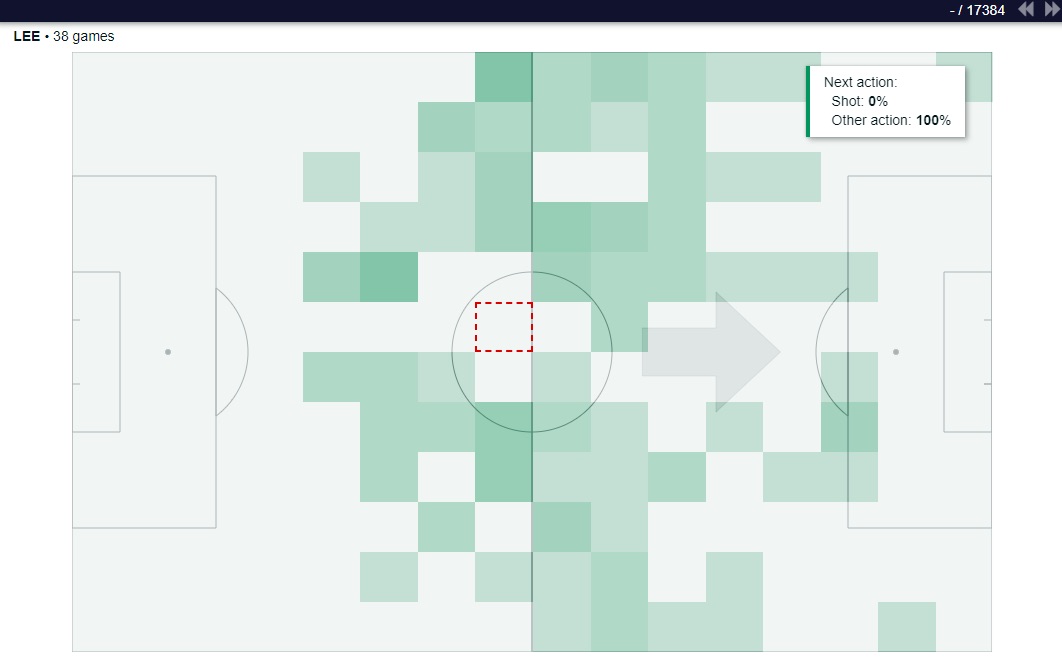
We now have 36 variables describing an individual action. The table above shows the distribution of predictions according to the type of action. For instance, the Shot Action logically has the highest probability of scoring a goal in the next few actions, while the Foul Action rarely ends with a goal, since the opponent will necessarily perform the next action.
By the same token, a foul is more likely to result in conceding a goal in future. In fact, fouling close to goal often leads to dangerous situations from a defensive point of view. We can see that the probabilities of scoring/conceding between action types seem to be negatively correlated. For example, a Crossed Corner is a purely offensive action which will always have a certain probability of scoring and a low probability of conceding a goal. On the other hand, a Clearance is a defensive action carried out in a context where the opposing team is putting pressure on its goal.

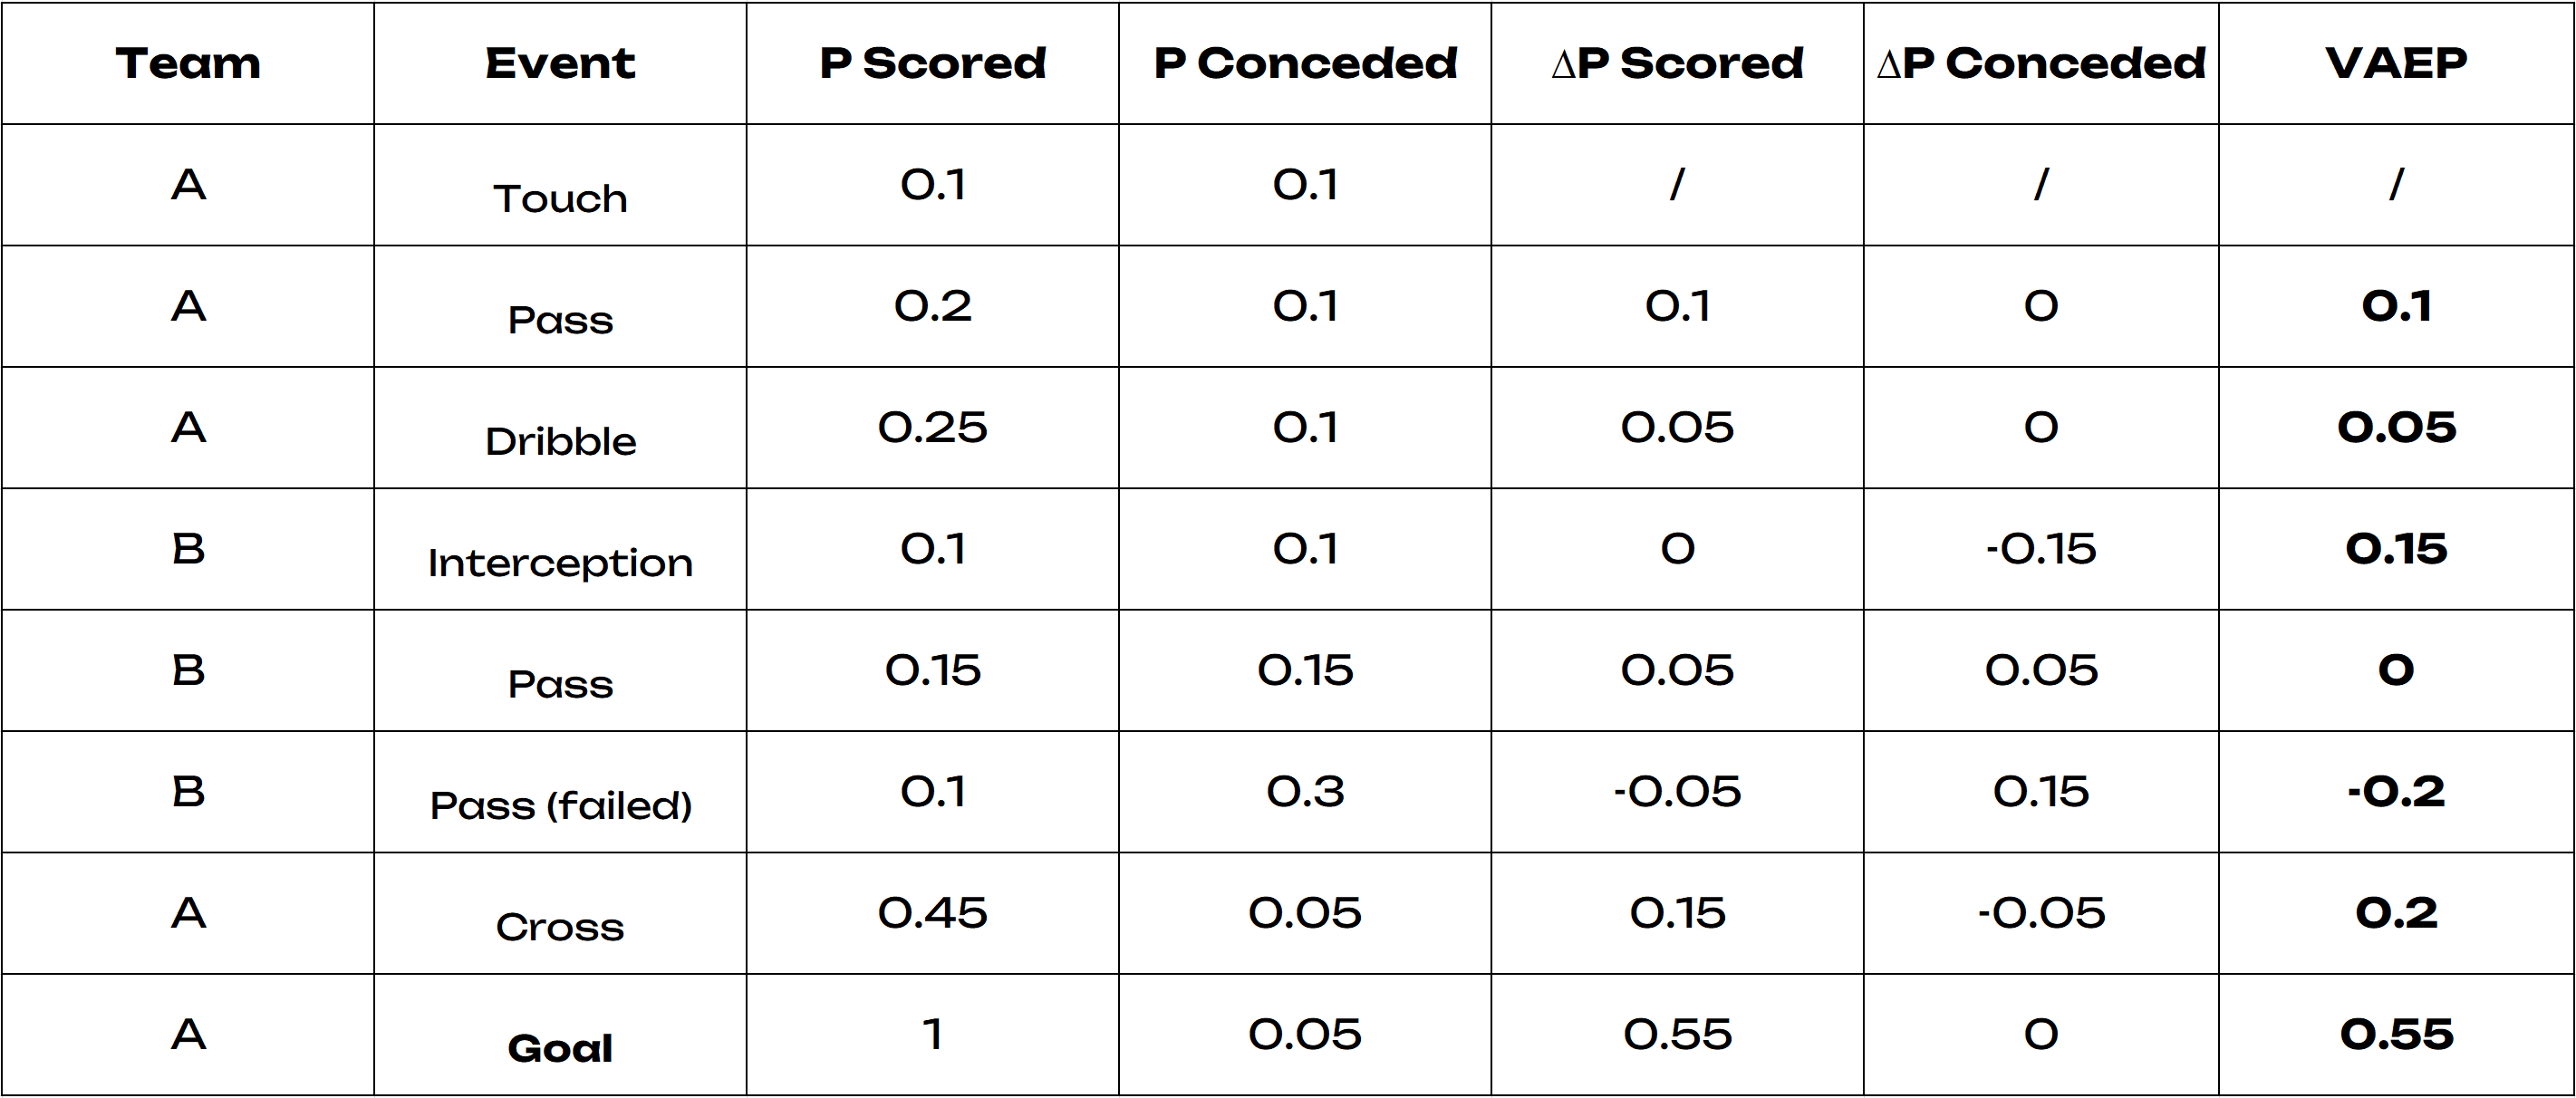
The VAEP Delta calculates the change in threat caused by each consecutive action. The table below shows an example of a set of actions and their respective VAEP values. In essence, a high VAEP action is determined by the difference between its offensive contribution (∆PScored) and its danger limitation (∆PConceded). Thus, calculating the deltas allows us to measure how an individual action has increased or decreased the probability that the team scores or concedes a goal.
To enrich the metric, we enlisted the help of Footovision’s 1200+ key performance indicators, creating a hierarchy of KPIs based on these insights to give greater weighting to more important indicators of performance. VAEP is available as a KPI on Footovision’s Coachvision analysis platform, both as a brute value for a player over one/several games, or as a ∆VAEP to represent how much value a player added or subtracted from their team as a whole. It represents the football industry’s most holistic attempt at objectively measuring performance thus far.


